Perfume.js
Page Speed is a feature, and to deliver it we need to understand the many factors and fundamental limitations that are at play. If we can measure it, we can improve it.
Star Follow @zizzamiaWhy Perfume.js?
Perfume is a tiny, web performance monitoring library that reports field data back to your favorite analytics tool.
- ⏰ Supports latest Performance APIs for precise metrics
- 🚀 Device data enrichment
- 🔨 Cross browser tested
- 🚿 Filters out false positive/negative results
- 🤙 Only 2Kb Javascript gzip
- 🏅 Web Vitals Score
- 🛰 Flexible analytics tool
- ⚡️ Waste-zero ms with requestIdleCallback strategy built-in
The latest in metrics & Real User Measurement
Perfume leverages the latest Performance APIs to collect field data that allows us to understand what real-world users are actually experiencing.
- Navigation Timing
- Navigator Interface
- Resource Timing
- Service Worker Status
- StorageManager interface
- First Paint (FP)
- First Contentful Paint (FCP)
- Largest Contentful Paint (LCP)
- First Input Delay (FID)
- Cumulative Layout Shift (CLS)
- Total Blocking Time (TBT)
- Navigation Total Blocking Time (NTBT)
- Element Timing
With Perfume.js, you can collect these metrics to develop a deeper understanding of how customers around the world perceive web performance for your application.
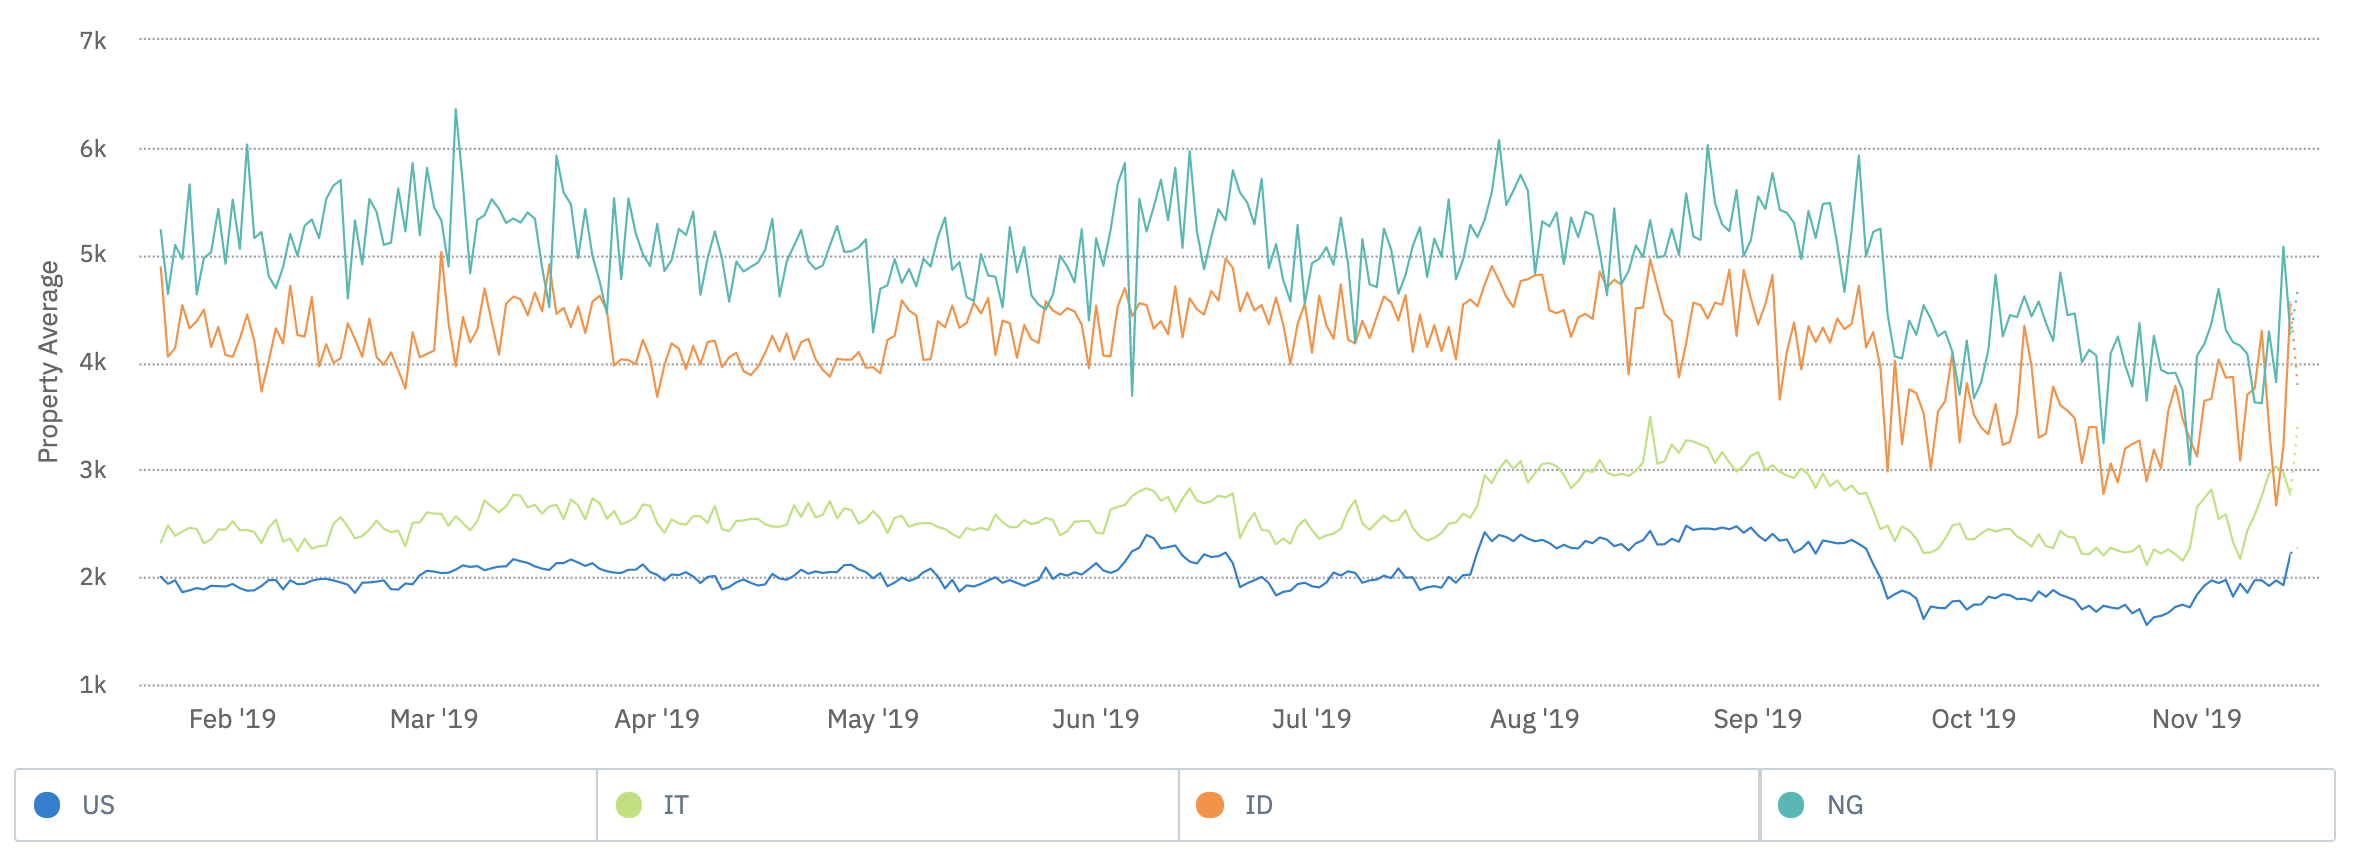
Use your favorite analytics tool to visualize the data from country to country. Take a look at this example comparing FCP for coinbase.com in the United States, Italy, Indonesia, and Nigeria.
Installing and Imports
// Install npm install perfume.js --save // Importing library // Import the generated bundle to use the whole library generated: import Perfume from 'perfume.js'; // Universal Module Definition: import Perfume from 'node_modules/perfume.js/perfume.umd.js'; |
Customize
Default Options
Default options provided to Perfume.js constructor.
const options = { resourceTiming: false, elementTiming: false, analyticsTracker: options => {}, maxMeasureTime: 30000, }; |
Contacts
Copyright and licenses
Code and documentation copyright 2022 Leonardo Zizzamia. Code released under the MIT license. Docs released under Creative Commons.

Navigation Timing First Paint First Contentful Paint Largest Contentful Paint First Input Delay Cumulative Layout Shift Total Blocking Time Navigation Total Blocking Time Resource Timing Annotate metrics Component First Paint Element Timing
Default OptionsCopyright and licenses